
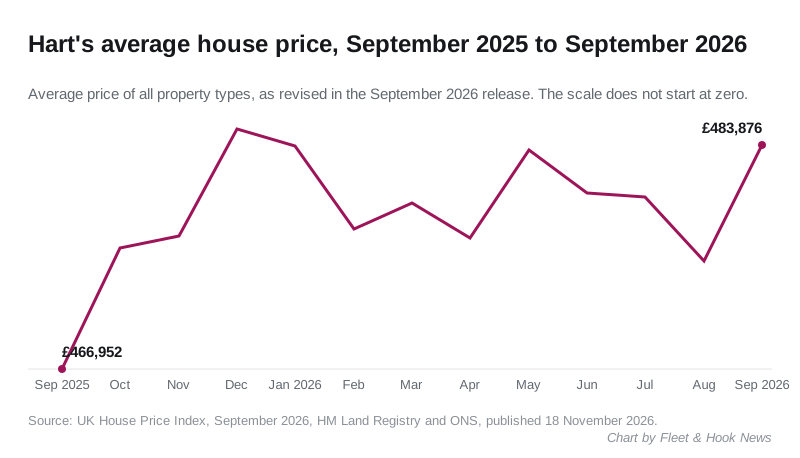
Hart's average house price rose 1.8% in September to £483,876, up 3.6% on a year. No other Hampshire district grew faster, and August was revised up.
The average home in Hart cost £483,876 in September, up 1.8% on August. Over the year prices rose 3.6%, or £16,924. That is the fastest annual rise of Hampshire’s eleven districts, and Hart is still the dearest of them.
The figures are from the UK House Price Index for September, published by HM Land Registry and the Office for National Statistics on 18 November. (GOV.UK) Every figure here comes from the index’s full data file for the month. (HM Land Registry, UK HPI full file, September 2026)
The index is a mean average, not a median. A few expensive sales can move it, and Hart records only around 90 to 120 sales a month, so one month is a small sample.
Overview
- Average price in September: £483,876
- Change on August: up 1.8%
- Change on September 2025: up 3.6%
- Rank in Hampshire: dearest, and fastest-rising of eleven districts
- Rank in England: 39th dearest of 295 local authority areas
Close to last December’s high
September’s average is the second highest the index has recorded for Hart. The highest is December 2025, at £485,063 as now revised. September is £1,187 short of it.
The yearly rise looks strong partly because of where it is measured from. Prices in Hart fell 0.5% between August and September 2025, so last September is a low starting point. Over the twelve months to September, the average has moved within a band of about £18,000.
August has been revised up
On 6 November we reported Hart’s August average as £472,755, up 0.7% on a year. (Fleet & Hook News, 6 November) More sales from August have since been registered. August now stands at £475,144, up 1.2% on a year. The index revises every month in this way, and September will move too.
| Month | Average price | Change on a year earlier |
|---|---|---|
| December 2025 | £485,063 | 3.6% |
| January 2026 | £483,753 | 4.0% |
| April 2026 | £476,832 | 2.6% |
| July 2026 | £479,968 | 2.4% |
| August 2026 | £475,144 | 1.2% |
| September 2026 | £483,876 | 3.6% |
All figures as revised in the September release.
What each kind of home costs
Every type of home rose in price between August and September, by between 1.7% and 1.9%. Semis have done best over the year. Flats are rising again: in the revised August figures they were down 1.1% on a year.
| Type | Average, September 2026 | Change on a year earlier |
|---|---|---|
| Detached | £797,673 | up 3.6% |
| Semi-detached | £483,570 | up 4.9% |
| Terraced | £386,528 | up 3.9% |
| Flat or maisonette | £240,650 | up 1.6% |
| First-time buyer | £361,007 | up 3.6% |
Buyers with a mortgage paid an average of £491,232, up 3.7% on the year. Cash buyers paid £461,517, up 3.4%.
How Hart compares
Hart’s 3.6% rise is well ahead of the next Hampshire districts:
- Gosport, up 2.1%
- Basingstoke and Deane, up 2.0%
- Fareham, up 1.8%
Four Hampshire districts saw prices fall over the year: East Hampshire, Test Valley, Havant and the New Forest. Hampshire as a whole rose 0.8%, and the South East fell 0.2%.
Across England, 108 of the 295 local authority areas saw prices fall over the year. Hart’s rise ranks 50th.
| Area | Average, September 2026 | Change on a year earlier |
|---|---|---|
| Waverley | £560,795 | up 0.5% |
| Wokingham | £494,973 | down 1.8% |
| Hart | £483,876 | up 3.6% |
| Surrey Heath | £464,274 | up 1.6% |
| Winchester | £462,947 | up 1.3% |
| East Hampshire | £443,579 | down 0.1% |
| Bracknell Forest | £392,056 | down 1.8% |
| Basingstoke and Deane | £374,764 | up 2.0% |
| Rushmoor | £328,774 | up 0.9% |
| Hampshire | £364,701 | up 0.8% |
| South East | £378,915 | down 0.2% |
| England | £292,998 | up 0.8% |
Of Hart’s neighbours, only Waverley and Wokingham are dearer. Wokingham’s lead is now £11,097, because its prices have fallen 1.8% over the year while Hart’s have risen.
Sales are thin
The latest sales count in the index is for July, because recent months take time to register. It shows 89 sales in Hart in July, the fewest of any month in 2026. That is one reason the monthly average swings as much as it does.
What it means for you
- If you are selling, the index puts Hart back near last winter’s peak, after a dip over the summer. One strong month is not yet a trend.
- If you are buying a first home, the first-time buyer average is £361,007, up 3.6% on the year, the same rate as homes overall.
- If you own a flat, values are rising again, but at 1.6% a year they are rising at less than half the pace of houses.
- For prices on your own street, use Land Registry’s sold prices search. The district figures here will be revised next month, as August’s were.
Have your say