
Hart's average house price fell 1.4% in August to £472,755, and the yearly rise slowed to 0.7%. July's rise has been revised away, and flats are now falling.
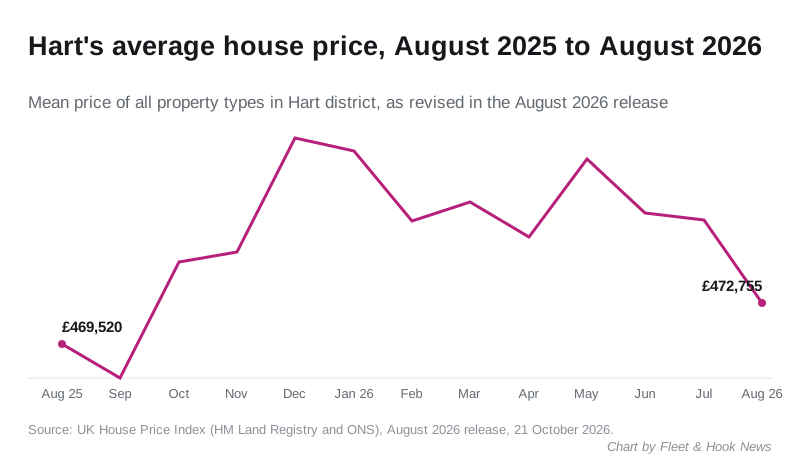
The average home in Hart cost £472,755 in August, down 1.4% on July. That is still £3,235 more than a year earlier, a rise of 0.7%. Hart’s yearly rate has not been that low since October 2025.
The figures come from the UK House Price Index for August, published by HM Land Registry and the Office for National Statistics on 21 October. (GOV.UK) The district figures are in the index’s own data service. (HM Land Registry, Hart, August 2026)
The index is a mean average, not a median. A handful of expensive sales can move it, and in a district the size of Hart a single month is a small sample.
July’s rise has been revised away
In September we reported that Hart’s July average was £481,051 and that the yearly rate had ticked up to 2.6%, the first rise in six months. (Fleet & Hook News, 18 September)
The index revises every month as more completed sales are registered. July now stands at £479,374, with a yearly rate of 2.2%. June has been revised to 2.3%, so July was not a rise after all. The yearly rate has slowed or held steady in every month since January 2026, when it peaked at 4.3%.
| Month | Average price | Change on a year earlier |
|---|---|---|
| January 2026 | £484,915 | 4.3% |
| March 2026 | £480,800 | 3.3% |
| June 2026 | £479,935 | 2.3% |
| July 2026 | £479,374 | 2.2% |
| August 2026 | £472,755 | 0.7% |
All figures as revised in the August release.
What each kind of home costs
Every type of property fell in price between July and August, by between 1.1% and 1.5%. Over the year, semis have done best and flats are the only type to have fallen.
| Type | Average, August 2026 | Change on a year earlier |
|---|---|---|
| Detached | £777,587 | up 0.5% |
| Semi-detached | £471,690 | up 1.8% |
| Terraced | £378,519 | up 1.3% |
| Flat or maisonette | £236,217 | down 1.2% |
| First-time buyer | £352,968 | up 0.7% |
Buyers with a mortgage paid an average of £479,824, up 0.8% on the year. Cash buyers paid £451,222, up 0.5%.
How Hart compares
Hart is still the most expensive of Hampshire’s eleven districts, ahead of Winchester at £453,188. The cheapest is Gosport at £240,093.
Several neighbouring areas are now seeing prices fall over the year. Hart’s 0.7% rise is modest, but it is better than most of the places around it.
| Area | Average, August 2026 | Change on a year earlier |
|---|---|---|
| Waverley | £559,306 | down 2.0% |
| Wokingham | £491,944 | down 2.5% |
| Hart | £472,755 | up 0.7% |
| Surrey Heath | £457,981 | up 1.5% |
| East Hampshire | £440,599 | down 1.7% |
| Bracknell Forest | £391,521 | down 2.3% |
| Basingstoke and Deane | £373,551 | up 2.2% |
| Rushmoor | £326,799 | no change |
| Hampshire | £364,628 | up 0.5% |
| South East | £379,953 | down 0.8% |
| England | £293,525 | up 0.4% |
Source for every figure: UK House Price Index, August 2026, via HM Land Registry’s data service.
What it means for you
- If you are selling, the index says Hart prices are flat over the year and have dipped since the spring. A valuation based on last winter’s prices may now be optimistic.
- If you are buying a first home, the first-time buyer average of £352,968 is up 0.7% on the year, the same rate as homes overall.
- If you own a flat, yours is the only type of home in Hart worth less on average than a year ago.
- Do not read one month as a trend. August’s figures will be revised as more sales are registered, as July’s were. For prices on your own street, use Land Registry’s sold prices search or our Fleet house prices page.
Have your say