
1,125 people in Hart claimed out-of-work benefits in October, up 55 in a month. The rate of 1.8% is still the lowest of Hampshire's 13 council areas.
Overview
1,125 people in Hart were claiming out-of-work benefits in October 2026. That is 55 more than in September, a rise of 5.1% in one month. Only Winchester rose faster in Hampshire.
The rate is 1.8% of residents aged 16 to 64. That is still the lowest of Hampshire’s 13 council areas, and only five council areas in the UK have a lower rate.
The figures are the Office for National Statistics claimant count for October 2026, published on Tuesday 17 November. (ONS claimant count via Nomis)
The headline numbers
| October 2025 | October 2026 | Change | |
|---|---|---|---|
| Hart | 1,035 | 1,125 | up 90 (8.7%) |
| South East | 179,900 | 187,915 | up 8,015 (4.5%) |
| United Kingdom | 1,650,220 | 1,707,320 | up 57,100 (3.5%) |
Hart’s count grew more than twice as fast as the UK’s over the year. Because the base is small, a few dozen claims move the percentage a long way.
The UK claimant rate is 3.9% and the South East’s is 3.2%. Hart’s 1.8% is less than half the UK figure.
October’s 1,125 is the highest October count in Hart since 2021, when it was 1,185. It matches June 2026 and sits just below March 2026’s 1,135, the highest month in the last five years.
September has been revised down
The ONS has revised its September figure for Hart from 1,090 to 1,070. That is why the month’s rise is 55 rather than 35. Revisions like this are routine: late claims are added and records are tidied in the month after first publication.
We have added a correction to our report on the September figures.
The rise this month came from 25 to 49 year olds
| Age group | September 2026 | October 2026 | October 2025 |
|---|---|---|---|
| 16 to 24 | 175 | 180 | 155 |
| 25 to 49 | 585 | 630 | 580 |
| 50 and over | 310 | 315 | 300 |
Between September and October, claims by 25 to 49 year olds rose by 45. The other two age groups moved by five each.
Over the full year the picture is different. Claims by 16 to 24 year olds are up 25, or 16%, the fastest rise of the three groups. Claims by 25 to 49s are up 50, or 8.6%, and by over-50s up 15, or 5%. (ONS age breakdown via Nomis)
Ward by ward
The ONS breaks the count down to Hart’s 11 wards. Crookham West and Ewshot had the biggest move. Its count went from 130 to 155 in a month, and it now has more claimants than any other ward.
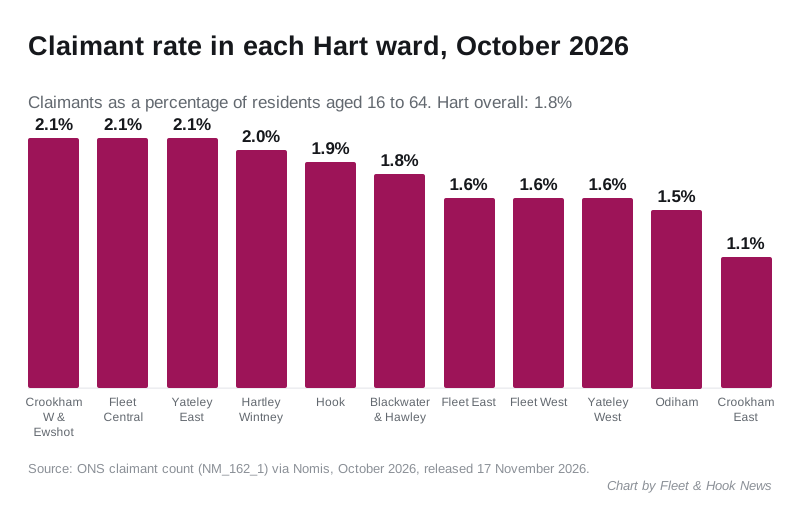
| Ward | September 2026 | October 2026 | Rate |
|---|---|---|---|
| Crookham West and Ewshot | 130 | 155 | 2.1% |
| Hook | 130 | 125 | 1.9% |
| Blackwater and Hawley | 115 | 120 | 1.8% |
| Fleet Central | 115 | 115 | 2.1% |
| Hartley Wintney | 110 | 105 | 2.0% |
| Fleet West | 85 | 100 | 1.6% |
| Yateley East | 100 | 100 | 2.1% |
| Fleet East | 75 | 85 | 1.6% |
| Odiham | 80 | 85 | 1.5% |
| Yateley West | 85 | 85 | 1.6% |
| Crookham East | 45 | 50 | 1.1% |
Fleet’s three wards hold 300 claimants between them, up 25 on September. Fleet West rose by 15. Hook and Hartley Wintney each fell by five.
Ward figures are rounded to the nearest five, but they add up exactly to the district total of 1,125. (ONS ward figures via Nomis)
How Hart compares with the rest of Hampshire
| Council area | September | October | Monthly change | Rate |
|---|---|---|---|---|
| Hart | 1,070 | 1,125 | up 5.1% | 1.8% |
| Fareham | 1,320 | 1,365 | up 3.4% | 2.0% |
| Test Valley | 1,585 | 1,650 | up 4.1% | 2.0% |
| Winchester | 1,630 | 1,725 | up 5.8% | 2.1% |
| East Hampshire | 1,615 | 1,635 | up 1.2% | 2.2% |
| Eastleigh | 1,970 | 2,020 | up 2.5% | 2.3% |
| New Forest | 2,220 | 2,320 | up 4.5% | 2.4% |
| Basingstoke and Deane | 3,305 | 3,430 | up 3.8% | 2.8% |
| Rushmoor | 2,060 | 2,135 | up 3.6% | 3.1% |
| Havant | 2,390 | 2,440 | up 2.1% | 3.3% |
| Gosport | 1,795 | 1,870 | up 4.2% | 3.7% |
| Southampton | 7,350 | 7,495 | up 2.0% | 4.2% |
| Portsmouth | 6,330 | 6,540 | up 3.3% | 4.5% |
Every council area in Hampshire saw its count rise in October. Rushmoor, next door, has a rate of 3.1%. Basingstoke and Deane is at 2.8%. (ONS claimant count for all council areas)
The five UK council areas with a lower rate than Hart are the City of London, the Shetland Islands, the Isles of Scilly, the Orkney Islands and Rutland.
What the claimant count measures
The claimant count is not the same as unemployment. It counts people claiming Jobseeker’s Allowance, plus people on Universal Credit who are required to look for work. Some people in low-paid work can be included. That is one reason the count is much higher than before the pandemic: Hart had 425 claimants in October 2019.
It is published every month down to ward level, which makes it the most local regular measure of people looking for work.
What it means for you
- Hart still has the lowest claimant rate in Hampshire, but the count rose in October across every age group.
- If you are job hunting, the National Careers Service gives free careers advice in England.
- The November figures are due from the ONS in December. September’s revision shows the first figure for a month can move by 20 or more in Hart.
Sources
- Office for National Statistics, claimant count (dataset NM_162_1) via Nomis, released 17 November 2026: Hart’s monthly count, rate and age breakdown for October 2019, 2021, 2025 and 2026 and for every month of 2026; the revised September 2026 figures; the ward figures; the South East and UK totals; and the September and October 2026 counts and rates for every UK council area. Counts are rounded to the nearest five.
Have your say